
Choosing the right fleet brake pads is one of the most impactful decisions you can make for your commercial vehicle program. Every stop your trucks, buses, and trailers make puts stress on brake components — and the wrong pads drain your budget faster than you might expect.
Brake pad performance goes far beyond basic stopping power. For fleet operations, it means consistent friction from sub-zero mornings to scorching highway descents above 1,200°F. It means wear rates low enough to push replacement intervals 30–40% further than economy-grade options. And it means keeping drivers safe under loads reaching 80,000 pounds GVWR.
Your total cost of ownership TCO depends on much more than the price printed on a purchase order. Fleet maintenance labor, vehicle downtime, rotor replacements, and compliance penalties all factor in. A cheaper commercial brake pad that wears out twice as fast is never the bargain it appears to be.
This guide walks you through everything you need to evaluate when selecting a brake pad supplier for your fleet. We cover material types, duty ratings, certification standards, and practical cost calculations. Whether you manage ten trucks or ten thousand, the goal is the same — smarter brake pad selection that protects your drivers and your bottom line.
Why Fleet Brake Pads Fail Faster: Common Brake Problems and High-Wear Conditions
Fleet vehicles push brake pads far beyond what a typical passenger car demands. Stop-and-go delivery routes can increase brake pad wear by up to 60% compared to steady highway driving. Urban fleets alone average 15,000–20,000 brake applications per month. That kind of stress makes brake pad failure a predictable outcome — not a surprise.
Many fleet brake problems and truck brake pad failures trace back to heat.When brake temperatures repeatedly exceed 600°F, brake glazing sets in. This creates a hardened surface layer on the pad that cuts the friction coefficient by 25–35%. The result is reduced stopping power and a dangerous increase in brake fade during sustained descents or heavy traffic.
Fleets running Freightliner Cascadia or Volvo VNL tractors in mountainous regions see this firsthand. Brake pad life can drop to 40,000–50,000 miles — roughly half the 80,000–100,000 miles expected in flatland operations. Repeated thermal cycling in these conditions leads to commercial brake pad cracking on rotor and pad surfaces, accelerating premature brake wear across the entire axle.
Improper bedding procedures are another frequent culprit. Skipping the recommended 20–30 moderate stops from 30 mph creates transfer layer irregularities. This directly causes uneven wear patterns, brake judder, and early pad replacement.

You can address many of these issues through driver behavior monitoring. Telematics platforms from Samsara fleet management platform and Geotab telematics solutions help fleet managers identify aggressive braking patterns before they cause costly damage. Key indicators to track include:
- Hard brake events per trip or route
- Average speed before braking
- Frequency of braking on downhill grades
- Pad replacement intervals per vehicle versus fleet average
Understanding these high-wear conditions is the first step. In the next section, we break down the specific operating conditions — route type, load weight, and climate — that directly shape your brake pad lifespan and maintenance costs.
Fleet Operating Conditions That Impact Brake Pad Lifespan and Maintenance Costs
Not all fleets wear brake pads at the same rate. The fleet operating conditions your vehicles face — from stop-and-go city routes to long-haul highway stretches — create very different wear profiles. Understanding these variables is the first step toward smarter maintenance scheduling and lower total costs.
Route Type and Driving Patterns
Urban delivery fleets running trucks like the Isuzu NPR or International MV Series average 200–300 brake applications per day. That constant braking cuts brake pad lifespan to roughly 25,000–35,000 miles. Highway-dominant fleets using Kenworth T680 or Peterbilt 579 tractors see 50–70% longer pad life — often reaching 70,000–90,000 miles between replacements.
Route optimization plays a big role here. Fleets that map routes to reduce unnecessary stops and steep-grade descents can extend pad life by thousands of miles per cycle.
Load Weight and GVWR Considerations
Heavier loads demand more braking energy. A fully loaded 80,000-pound combination generates brake temperatures about 40% higher than an empty backhaul run. The GVWR impact is measurable — each 10,000-pound increase in gross vehicle weight reduces pad life by roughly 15%.
| Load Condition | Avg. Brake Temp Increase | Estimated Pad Life Reduction |
|---|---|---|
| Empty (30,000 lbs) | Baseline | None |
| Half Load (55,000 lbs) | +20% | ~15–25% |
| Full Load (80,000 lbs) | +40% | ~35–45% |
Climate and Environmental Factors
Climate effects on brakes can be dramatic. Fleets based in Phoenix face ambient temperatures above 110°F, which accelerates pad wear by roughly 20%. In Minneapolis, road salt exposure — averaging 120 days per year — causes corrosion that degrades rotors and shortens pad service intervals.
- Hot climates increase thermal stress and glazing risk
- Cold, salt-heavy regions accelerate corrosion-related wear
- Humid coastal areas promote rust buildup on friction surfaces

Large carriers like J.B. Hunt and Schneider National segment their brake pad specs by region. This approach ties maintenance scheduling directly to environmental demands — a strategy any fleet can adopt to reduce unplanned downtime.
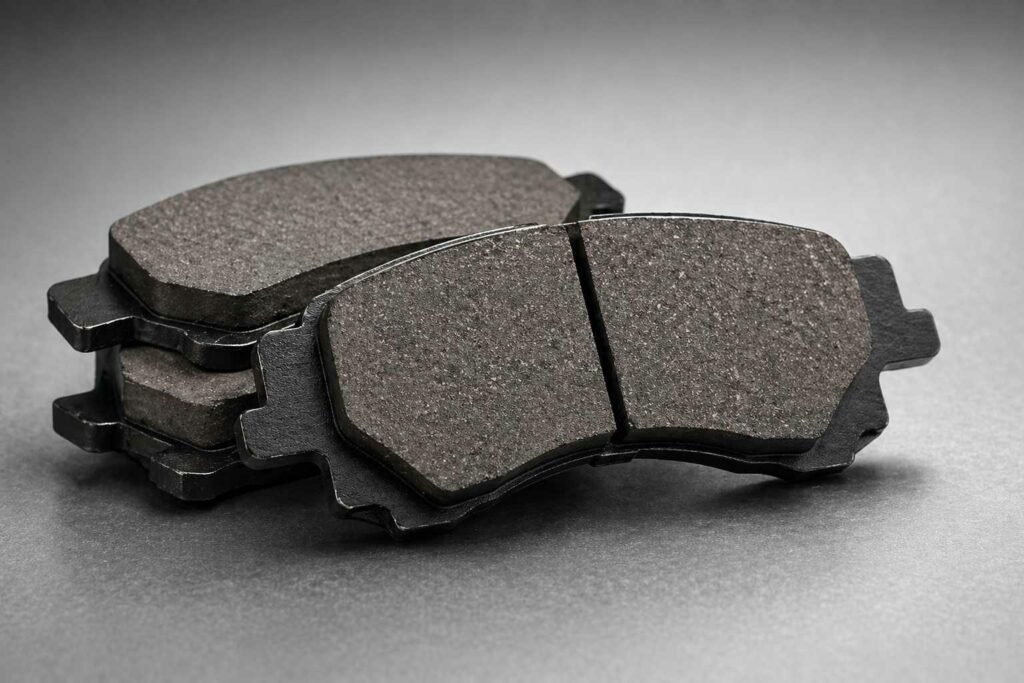
Brake Pad Material Types Explained: Ceramic vs Semi-Metallic for Fleet Applications
Choosing the right brake pad materials is one of the most impactful decisions you can make for your fleet. The friction materials in your commercial brake compounds shape everything — from stopping power and rotor wear to maintenance intervals and total cost. Two dominant categories lead the market for fleet use: ceramic brake pads and semi-metallic brake pads.Each serves a distinct purpose depending on your routes, loads, and operating demands.
Low Dust, Stable Friction, and Longer Rotor Life
Ceramic brake pads use dense ceramic fibers bonded with copper or other fillers.They maintain friction coefficients between 0.38 and 0.42 across temperatures up to 800°F. This consistency gives you predictable stopping performance in most urban and suburban conditions. Brake dust reduction is a major benefit — ceramic compounds produce up to 60% less dust than metallic alternatives. That matters for food service or branded fleets where clean wheels reflect your company image. Ceramic pads can extend rotor life by 15,000 to 20,000 miles, cutting replacement frequency.
Superior Heat Dissipation and Heavy-Load Performance
Semi-metallic brake pads contain 30–65% metal content — steel, iron, or copper. This composition excels at heat dissipation, staying effective at temperatures above 1,000°F. Mountain grade descents and heavy-load routes demand that kind of thermal resilience. Delivery fleets running frequent stop-and-go cycles benefit from the raw stopping power these commercial brake compounds provide. The tradeoff is higher rotor wear and more brake dust.
Brake Pad Material Comparison Chart
| Performance Factor | Ceramic Brake Pads | Semi-Metallic Brake Pads |
|---|---|---|
| Friction Coefficient Range | 0.38–0.42 | 0.35–0.50 |
| Max Effective Temperature | Up to 800°F | Over 1,000°F |
| Brake Dust Output | Low (60% less) | Moderate to High |
| Rotor Life Extension | 15,000–20,000 extra miles | Standard wear rate |
| Initial Cost | 20–30% higher | Lower per unit |
| Best Fleet Application | Urban, light-medium duty | Heavy-load, high-temp routes |
Key Performance Factors: Friction Stability, Wear Rate, and Brake Fade Resistance
When selecting brake pads for your fleet, brake performance metrics tell you exactly what to expect on the road. Three factors stand out above all others — friction stability, wear rate, and fade resistance. Each one directly affects safety, cost, and vehicle uptime.
A consistent friction coefficient is the foundation of predictable braking. Premium fleet pads maintain coefficient variation within ±0.05 across a temperature range of 200°F to 650°F. That kind of thermal stability prevents erratic stopping distance — a factor the FMCSA links to roughly 12% of commercial vehicle accidents. If your pads can’t hold a steady grip as temperatures climb, your drivers face real danger on steep grades and in stop-and-go traffic.
Wear rate measurement is just as critical for managing replacement costs. Here’s how pad quality levels compare in real fleet use:
| Pad Grade | Wear Rate (mm per 10,000 miles) | Estimated Pad Life (miles) | Annual Replacements (50,000 mi/yr) |
|---|---|---|---|
| Premium Formulation | 0.8 mm | 60,000–80,000 | 1 |
| Mid-Grade Formulation | 1.1 mm | 40,000–55,000 | 1–2 |
| Economy Formulation | 1.5 mm | 25,000–35,000 | 2–3 |
Brake fade resistance testing separates premium pads from budget options during sustained high-demand braking. Testing under FMVSS 121 protocols shows that top-tier pads — like those from Bendix — retain about 85% effectiveness after 20 consecutive stops from 60 mph. Economy alternatives can drop to just 65% effectiveness under the same conditions.
Large fleet operators such as FedEx Ground contractors now specify minimum brake fade resistance thresholds in their procurement contracts. They require dynamometer test data showing less than 20% friction loss during standardized fade sequences. You should demand the same level of documentation from your supplier — it’s the clearest way to verify stopping distance reliability across your entire fleet.
Heavy Duty vs Severe Duty Brake Pads: What’s the Difference in Real Fleet Use?
Many fleet managers treat all commercial brake classifications as interchangeable. That mistake leads to premature wear, unexpected downtime, and wasted budget. The gap between heavy duty brake pads and severe duty brakes is real — and it shows up fast in the field.
Heavy duty brake pads are built for Class 7–8 trucks running standard highway and regional routes. These pads handle loads up to 80,000 pounds GVWR and deliver service intervals of 70,000 to 100,000 miles under normal conditions. They’re the go-to choice for long-haul tractors and distribution fleets.

Severe duty brakes serve a different world. Refuse trucks, concrete mixers, and logging rigs push brake temperatures past 800°F on a regular basis. Severe-duty formulations pack roughly 25% more friction material and use heat-resistant binders to survive these extremes. Expect 40,000 to 60,000 miles of life in these punishing cycles — a major gain over standard pads that would fail far sooner.
Choosing the right brake pad ratings for each vehicle type is critical. Putting severe duty brakes on a highway tractor wastes money through over-engineering. Using heavy duty brake pads on a residential refuse route risks brake failure and potential DOT violations. Application-specific brakes matched to actual duty cycles protect both safety and budget.
| Feature | Heavy Duty Brake Pads | Severe Duty Brakes |
|---|---|---|
| Typical Vehicles | Class 7–8 highway tractors, regional haulers | Refuse trucks, concrete mixers, logging rigs |
| Service Interval | 70,000–100,000 miles | 40,000–60,000 miles (in extreme conditions) |
| Operating Temperatures | Up to 600°F | Routinely exceeds 800°F |
| Friction Material Thickness | Standard | ~25% more than standard |
| Initial Cost | Lower per unit | ~40% higher per unit |
| Best Use Case | Highway, regional distribution | Stop-and-go vocational routes |
Understanding these commercial brake classifications — and matching brake pad ratings to real-world duty cycles — sets the foundation for selecting application-specific brakes across your entire fleet. This distinction ties directly into vehicle-level selection for trucks, buses, and trailers covered next.
Application-Based Selection: Truck, Bus, and Trailer Brake Pad Requirements
Not every vehicle in your fleet faces the same braking demands. A long-haul semi-trailer stopping on a highway grade is a world apart from a city bus pulling into its 200th stop of the day. That’s why application-specific selection is critical — the right pad for the right job saves money and keeps drivers safe.
Heavy Duty Truck and Semi-Trailer Brake Pads
Truck brake pads for Class 7 and Class 8 vehicles must meet strict FMVSS 121 stopping distances — 250 feet from 60 mph at full GVWR. Tractor axle loads often reach 23,000 pounds, demanding pads with high heat tolerance and fade resistance. Trailer brakes present a different challenge. Extended parking periods cause corrosion and rust-jacking, so you need formulations that deliver consistent friction even after sitting idle for days or weeks.
Bus and Urban Delivery Fleet Brake Pads
Bus brake pad requirements go beyond raw stopping power. Transit vehicles like the New Flyer Xcelsior or Gillig Low Floor run constant stop-and-go cycles. Pads must be copper-free to meet California SB 346 standards while staying quiet — below 80 decibels — for passenger comfort. Urban delivery vans share many of the same needs: frequent braking, low noise, and long pad life across short routes.
Mixed Fleet Strategy: Standardizing vs Segmenting Brake Pad Specs
Mixed fleet management forces a real trade-off. Fleet standardization can cut your inventory by roughly 20% and simplify technician training. But forcing one pad across all duty cycles sacrifices performance. A smarter approach — used by operators like Penske Truck Leasing — segments brake pad SKUs into just three categories to cover 95% of the fleet.
| Strategy | Inventory Complexity | Performance Match | Training Effort |
|---|---|---|---|
| Full Standardization | Low (1–2 SKUs) | Compromised for some vehicles | Minimal |
| Segmented Selection | Moderate (3–4 SKUs) | Optimized per duty cycle | Moderate |
| Fully Custom per Vehicle | High (10+ SKUs) | Maximum per application | Extensive |
The sweet spot for most fleets sits in the middle. Segment by duty cycle — highway, urban, and trailer — and you gain the benefits of application-specific selection without drowning in part numbers.
Understanding Total Cost of Ownership (TCO) in Fleet Brake Pad Selection
Choosing OEM or aftermarket brake pads based on sticker price alone is one of the most costly mistakes you can make. The total cost of ownership tells a much deeper story — one that includes labor, downtime, rotor damage, and even regulatory penalties. A true TCO calculation exposes why a $180 economy pad set can end up costing far more than a $320 premium option over its full service life.
What TCO Actually Includes Beyond Part Price
Brake pad economics extend well past the purchase order. Lifecycle costing captures every expense tied to a brake pad from installation to replacement. Here’s what you should factor in:
- Labor costs — averaging $150–$200 per axle for each installation
- Vehicle downtime — valued at $400–$600 per day for revenue-generating trucks
- Rotor wear — inferior pads cause scoring, leading to $300–$400 per-wheel rotor replacements
- Roadside failures — towing expenses average $350 per incident
- CSA violations — out-of-service orders can raise insurance premiums by $500–$2,000
These operational expenses add up fast. When you account for all of them, a cheap pad set can cost 30–40% more over its lifecycle than a premium one.
How to Calculate Brake Pad TCO for Your Fleet
A practical TCO calculation compares pads across their full replacement cycle — not just one install. Use this framework to evaluate fleet maintenance costs per axle set:
| Cost Category | Economy Pad ($180/axle) | Premium Pad ($320/axle) |
|---|---|---|
| Pad Life (miles) | 40,000 | 56,000 |
| Replacements per 100K miles | 2.5 | 1.8 |
| Total Pad Cost | $450 | $576 |
| Total Labor Cost | $437 | $315 |
| Rotor Replacements | $700 | $350 |
| Downtime Cost | $1,250 | $900 |
| Estimated TCO per 100K Miles | $2,837 | $2,141 |
This lifecycle costing approach shows a 24% savings with premium pads. When you scale that across a 50-truck fleet, the difference in operational expenses reaches tens of thousands of dollars per year. That’s the real value behind informed brake pad selection.
How Brake Pad Lifespan and Replacement Intervals Affect Fleet Costs
Brake pad lifespan directly drives your bottom line. Every mile of wear translates into labor, parts, and downtime expenses. Understanding the link between replacement intervals and fleet costs gives you the power to cut spending without cutting corners on safety.
Fleets that track brake thickness using diagnostic tools like Noregon JPRO often discover up to 30% variation in wear rates across identical trucks. The cause? Driver behavior and route differences. This data is critical for maintenance scheduling — it lets you move from rigid mileage-based swaps to wear-based preventive maintenance that reflects real conditions.
Extending replacement intervals from 60,000 to 80,000 miles can save roughly $1,200 per truck each year through fewer shop visits and less downtime. This kind of service life optimization does require upgrading to premium pad formulations — expect about 25% higher upfront cost — but the net savings are substantial.
Telematics platforms like Bendix Wingman Fusion help fleets flag trucks wearing pads at 0.125 inches per 10,000 miles versus a fleet average of 0.100 inches. Targeted driver coaching based on this data can extend pad life by 15–20%.
Synchronized replacement — swapping all axle positions at once despite varied wear — is another strategy worth evaluating:
| Strategy | Shop Visits Reduced | Parts Cost Increase | Best For |
|---|---|---|---|
| Per-Axle Replacement | 0% | 0% | Fleets under 60,000 miles/year |
| Synchronized Replacement | Up to 40% | ~15% | Fleets over 100,000 miles/year |
| Predictive (Telematics-Based) | Up to 30% | ~10% | Mixed fleets with varied routes |
Aligning your brake pad replacement intervals with actual wear data — not just calendar dates — is the most effective way to reduce fleet costs while keeping every truck safe and road-ready.
Reducing Fleet Downtime Through Better Brake Pad Performance and Maintenance Planning
Every hour a vehicle sits in the shop is an hour it’s not generating revenue. Strategic brake maintenance planning paired with high-quality brake pads is one of the most effective levers you have for fleet downtime reduction. The key is shifting from reactive repairs to a proactive, scheduled approach.
Premium brake pads with predictable wear patterns let you plan service during off-peak windows — not during a Monday morning rush. Emergency brake repairs can sideline a vehicle for 8 to 12 hours. That’s a full day of lost productivity. Choosing pads with built-in wear indicators gives your team a 5,000-mile advance warning before reaching the replacement threshold, keeping vehicle availability rates above 95%.
Preventive maintenance optimization starts with the right tools and intervals. Electronic brake performance monitoring systems — like those from Knorr-Bremse or MGM Brakes — track pad thickness in real time. Fleets using these systems report up to 75% fewer unplanned brake failures. When you align brake pad replacement with other major services at consistent mileage intervals, you consolidate shop visits and cut total labor hours.
Here’s how reactive and proactive strategies compare in real fleet operations:
| Metric | Reactive Maintenance | Proactive Brake Maintenance Planning |
|---|---|---|
| Average Downtime Per Brake Event | 8–12 hours | 2–3 hours (scheduled) |
| Unplanned Brake Failures Per Year | 12–18 per 100 vehicles | 3–5 per 100 vehicles |
| Vehicle Availability Rate | 88–91% | 95–97% |
| Annual Brake-Related Breakdown Reduction | Baseline | Up to 35% |
Pairing quarterly inspections with premium pads rated for 100,000 miles — such as Meritor’s severe-duty line — lets you catch early signs of caliper drag or air system contamination before they cause premature wear. This approach directly supports fleet downtime reduction and keeps your operation running on schedule. The next step is making sure every pad you install meets the right regulatory standards.
Regulatory Compliance: Why ECE R90 and FMVSS Standards Matter for Fleet Brake Pads
Meeting brake pad standards is not optional — it’s a legal and safety baseline for every fleet. Regulatory requirements protect your drivers, your cargo, and your company from serious liability. Before you select a supplier, you need to understand what these standards test and how to confirm a product actually meets them.
ECE R90 Certification — What It Tests and Why European Fleets Require It
ECE R90 certification ensures aftermarket brake pads perform within ±15% of OEM friction levels. Testing covers cold effectiveness, high-speed braking, fade resistance, and recovery. Manufacturers like Textar and Ferodo run roughly 180 dynamometer tests per formulation to earn this mark. If you export vehicles or operate in European markets, ECE R90 certification is a mandatory regulatory requirement.
FMVSS 135 and FMCSA Air Brake Regulations — U.S. Federal Requirements
In the U.S., FMVSS brake compliance under Standard 121 requires commercial vehicles to stop within 250 feet from 60 mph. Brake pads must hold a minimum 0.38 friction coefficient after thermal conditioning at 500°F. FMCSA regulations add inspection-level enforcement — during annual Brake Safety Day checks, about 13% of vehicles are placed out of service. Common violations include pads worn below 1/4-inch thickness or contaminated with oil.
| Standard | Region | Key Requirement | Enforcement Method |
|---|---|---|---|
| ECE R90 | Europe | Friction within ±15% of OEM | Type-approval testing by TÜV or equivalent |
| FMVSS 121 | United States | Stop within 250 ft from 60 mph | Federal certification by manufacturer |
| FMCSA Inspection | United States | Pad thickness above 1/4 inch | Roadside and facility inspections |
How to Verify a Supplier’s Certifications Before You Buy
Compliance verification should happen before any purchase order is signed. Follow these steps:
- Request certification documents showing test lab accreditation from bodies like AMECA or TÜV.
- Confirm batch numbers on the product match the numbers listed on certificates.
- Ask for quarterly audit reports — reputable manufacturers like Tuoba provide these to qualified fleet customers.
Skipping compliance verification puts your fleet at risk during inspections and exposes you to costly legal claims. Validated brake pad standards give you confidence that every replacement pad performs as expected under real-world conditions.
How to Choose a Reliable Brake Pad Supplier for Fleet and Commercial Vehicles
Smart truck brake pad supplier selection goes far beyond comparing unit prices on a quote sheet. You need a partner who delivers proven supplier reliability across every shipment, offers real technical support when field issues arise, and keeps your fleet rolling without supply interruptions. Let’s break down what to evaluate during vendor qualification.
Consistency Over Price: Why Batch Stability Matters More Than Unit Cost
A low price means nothing if friction performance shifts from one delivery to the next. Batch consistency — keeping friction coefficient variation within ±0.03 — is what prevents unexpected brake behavior across your fleet. Leading suppliers document statistical process control with Cpk values above 1.33. This level of batch consistency protects you from liability exposure and unplanned maintenance spikes.
Testing Capability and Technical Support
Your vendor qualification process should confirm a supplier’s testing infrastructure. Look for these capabilities:
- On-site dynamometer facilities for friction and wear validation
- Fleet trial programs tailored to your specific routes and loads
- Third-party test reports from labs like Link Engineering or Greening Testing Laboratories
- 24/7 technical support for diagnosing field complaints quickly
Suppliers who invest in testing and technical support can solve application-specific problems — not just sell you parts.
Supply Chain Reliability and Lead Time Management
Strong supply chain management separates dependable vendors from risky ones. Top fleets require suppliers to maintain 60-day safety stock and hit 99.5% on-time delivery rates. Evaluate these factors during your assessment:
| Evaluation Criteria | Minimum Benchmark | Why It Matters |
|---|---|---|
| On-time delivery rate | 99.5% | Prevents downtime from stockouts |
| Safety stock level | 60 days | Buffers against demand spikes |
| Manufacturing locations | 2 or more | Reduces single-point failure risk |
| EDI integration | Full capability | Cuts procurement admin costs by up to 30% |
| Raw material transparency | Full copper-free compliance documentation | Ensures regulatory readiness |
Choosing a supplier with this level of supply chain management gives your fleet a competitive edge in uptime, cost control, and compliance — setting you up for the OEM vs. private label decision we’ll cover next.
OEM vs Private Label Brake Pads: Which Model Fits Your Fleet Strategy?
Your fleet procurement strategy often comes down to one key decision — OEM brake pads or private label brakes.OEM pads from brands like Bendix, Meritor, or Haldex match original equipment specs exactly. They protect you in accident litigation and keep warranty coverage intact on newer vehicles.
Private labeling through manufacturers like Tuoba opens the door to custom friction formulations. These are tuned for your specific routes and loads — not built as one-size-fits-all products. Custom aftermarket brake pads can last up to 15% longer than generic options while still costing less than OEM parts. That kind of precision gives you a clear edge in both performance and cost control.
The bottom line is simple. Your fleet procurement strategy should never rely on price alone or brand loyalty alone. Run a cost-benefit analysis that factors in pad life, stopping performance, downtime risk, and warranty status. The best brand selection is the one that fits your fleet’s operating conditions and long-term maintenance goals. Explore more custom fleet brake pad solutions from Tuoba. — not just a line item on a purchase order.